FPE vs Hits
Understanding the “Hits” Chart
What is going on here?
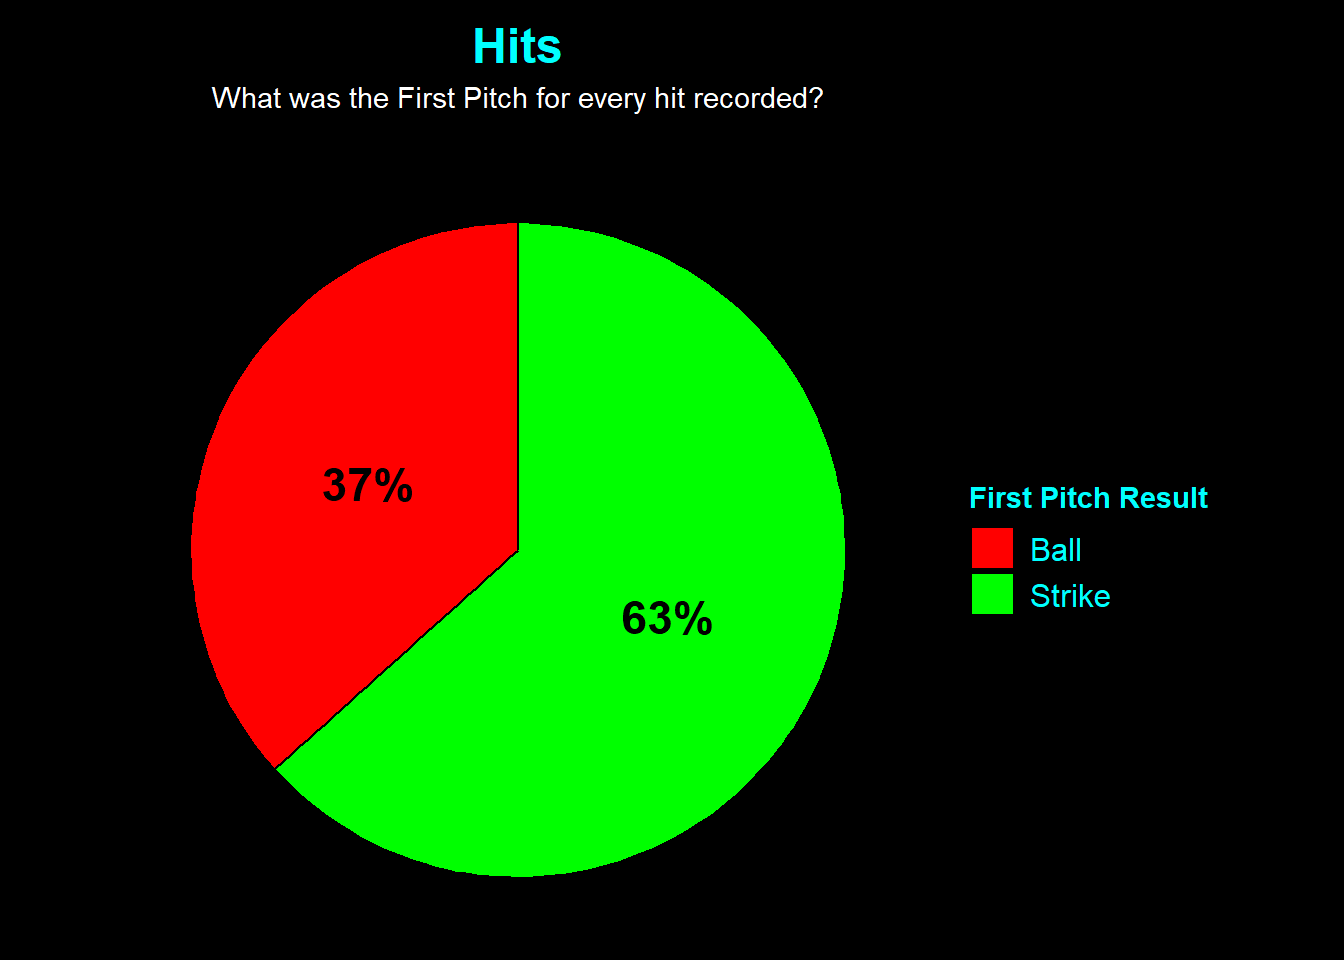
This chart isolates every at-bat that resulted in a Hit (Singles, Doubles, Triples, HRs). It categorizes them by the count:
Green Slice (Strike): Hits that happened after the batter started down 0-1.
Red Slice (Ball): Hits that happened after the batter started ahead 1-0.
⚠️ Why this data can be misleading
You might look at the large Green slice and think, “Throwing a strike leads to more hits!” However, this is the “Base Rate” Fallacy.
Pitchers throw strikes about 60-65% of the time.
Because there are significantly more 0-1 counts in a season, there will naturally be more hits coming from 0-1 counts, simply because the opportunity arises more often.
The Reality: Even though more hits total come from 0-1 counts, the batting average in those counts is much lower than in 1-0 counts.