FPE vs Strikeouts
Understanding the “Strikeouts” Chart
What is going on here?
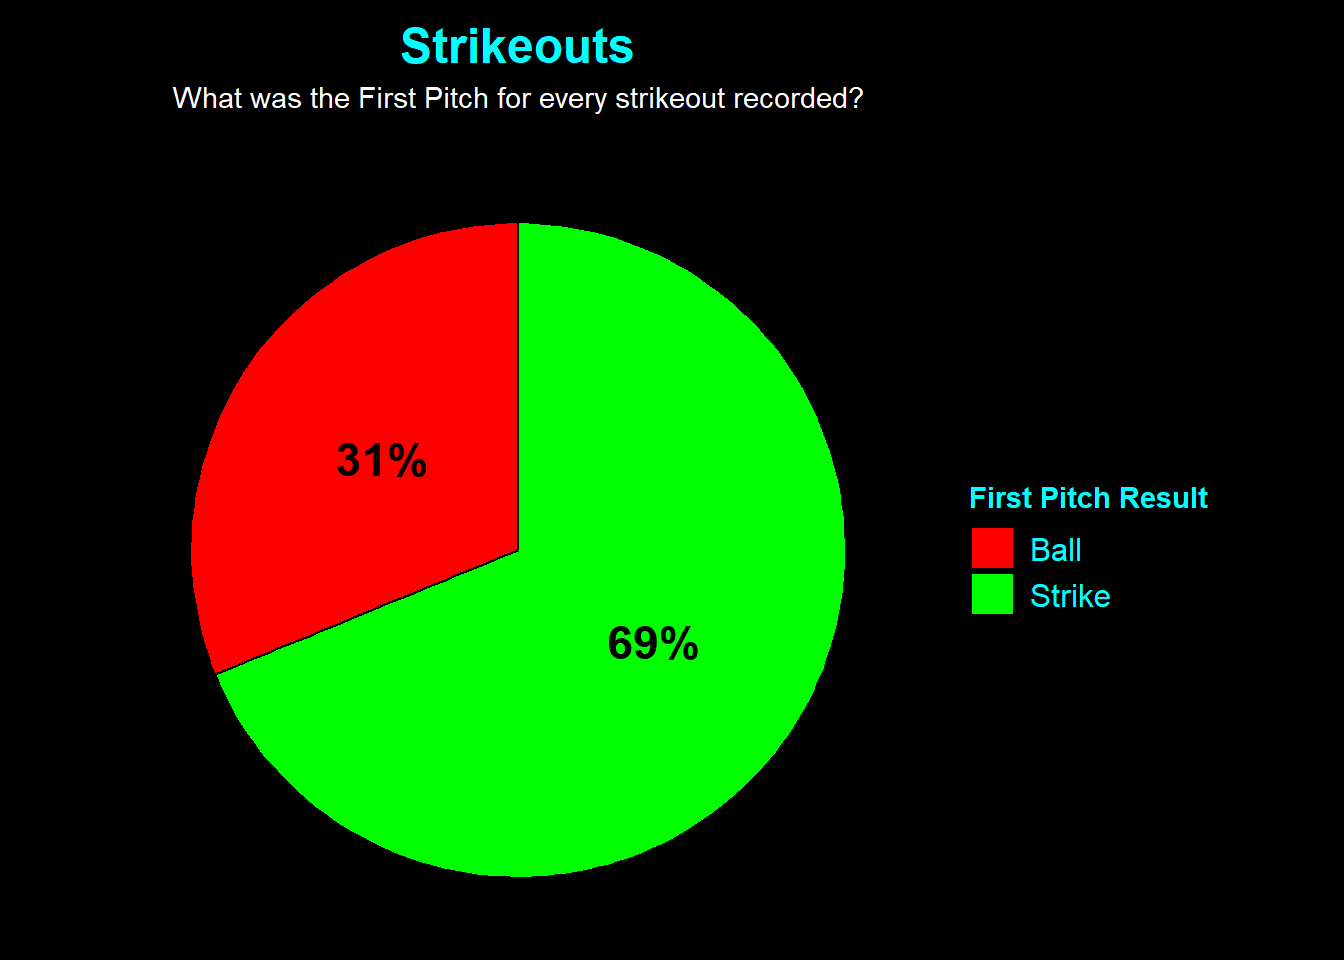
This chart isolates every Strikeout in the dataset. It answers the question: “When a pitcher struck someone out, did they start that battle with a Strike (Green) or a Ball (Red)?”
Why is this important?
This chart proves the value of “Getting Ahead.”
The Defensive Batter: When a pitcher starts 0-1, the batter enters a defensive mindset. They are forced to protect the plate, which allows the pitcher to use “Chase Pitches” (balls thrown outside the zone to tempt a swing).
The Kill Shot: Strikeouts rarely happen on pitches in the middle of the plate. They happen on the edges. You can only target the edges effectively if you are ahead in the count. A large Green slice here confirms that the path to a K starts with pitch #1.
⚠️ Why this data can be misleading
The “Comeback” K: A Red slice here is very impressive. It means the pitcher fell behind 1-0, but had the stuff/skill to battle back and still get the strikeout.
Foul Balls: A pitcher might start 0-1, but the batter fouls off 5 pitches. The eventual strikeout feels unrelated to that first pitch, yet this chart groups them together. It implies a direct causation that might be looser in reality.