FPE vs Walks
Understanding the “Walks” Chart
What is going on here?
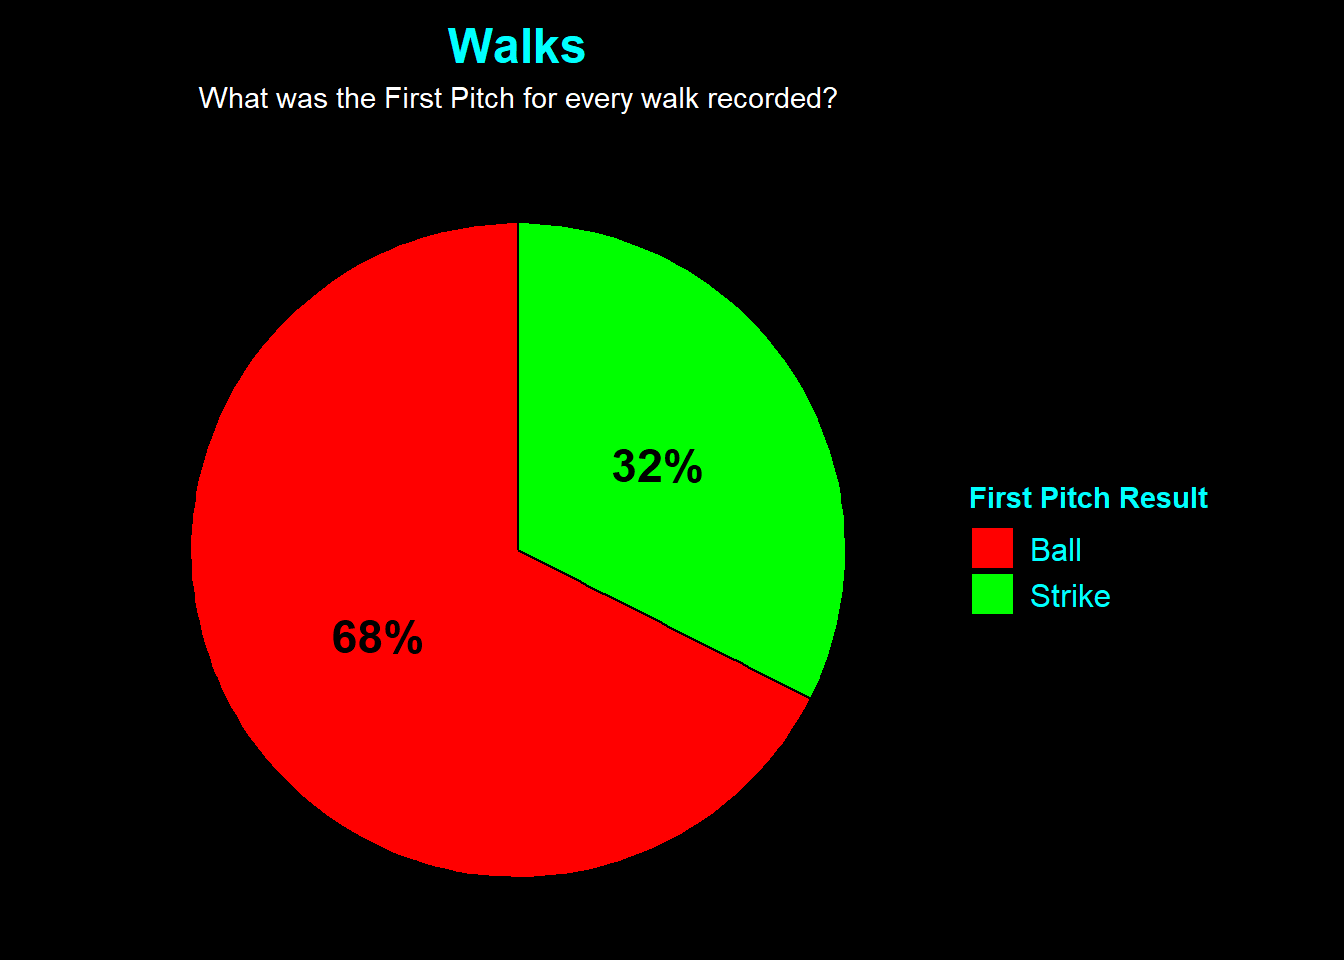
This chart looks at every base-on-balls (Walk) issued and traces it back to the first pitch.
Green Slice (Strike): The walk occurred after the pitcher started 0-1 (a rare collapse).
Red Slice (Ball): The walk occurred after the pitcher fell behind 1-0.
Why is this important?
This chart typically looks very different from the others. You should expect a massive Red slice.
The “Gateway Drug” to Walks: A 1-0 count is the gateway to a walk. Once a pitcher falls behind, the pressure mounts. They try to nibble at the corners to get back in the count, often missing again (2-0, 3-0), leading directly to a walk.
The “Comeback” Difficulty: It is incredibly difficult for a batter to work a walk after starting 0-1. They are in “swing mode” protecting the plate. Seeing a green slice here represents a significant failure by the pitcher to put the batter away.
⚠️ Why this data can be misleading
Intentional Unintentionality: Sometimes pitchers “pitch around” a dangerous hitter. They might start 1-0 not because they have bad control, but because they are being careful. If that turns into a walk, it looks like a failure on this chart, but it might have been a strategic decision.
Umpire Error: A 1-0 count might actually be a perfect pitch that the umpire called a Ball. This chart assumes the classification of “Ball” was correct, but human error plays a huge role in walk rates.