FPE vs Outs
Understanding the “Outs” Chart
What is going on here?
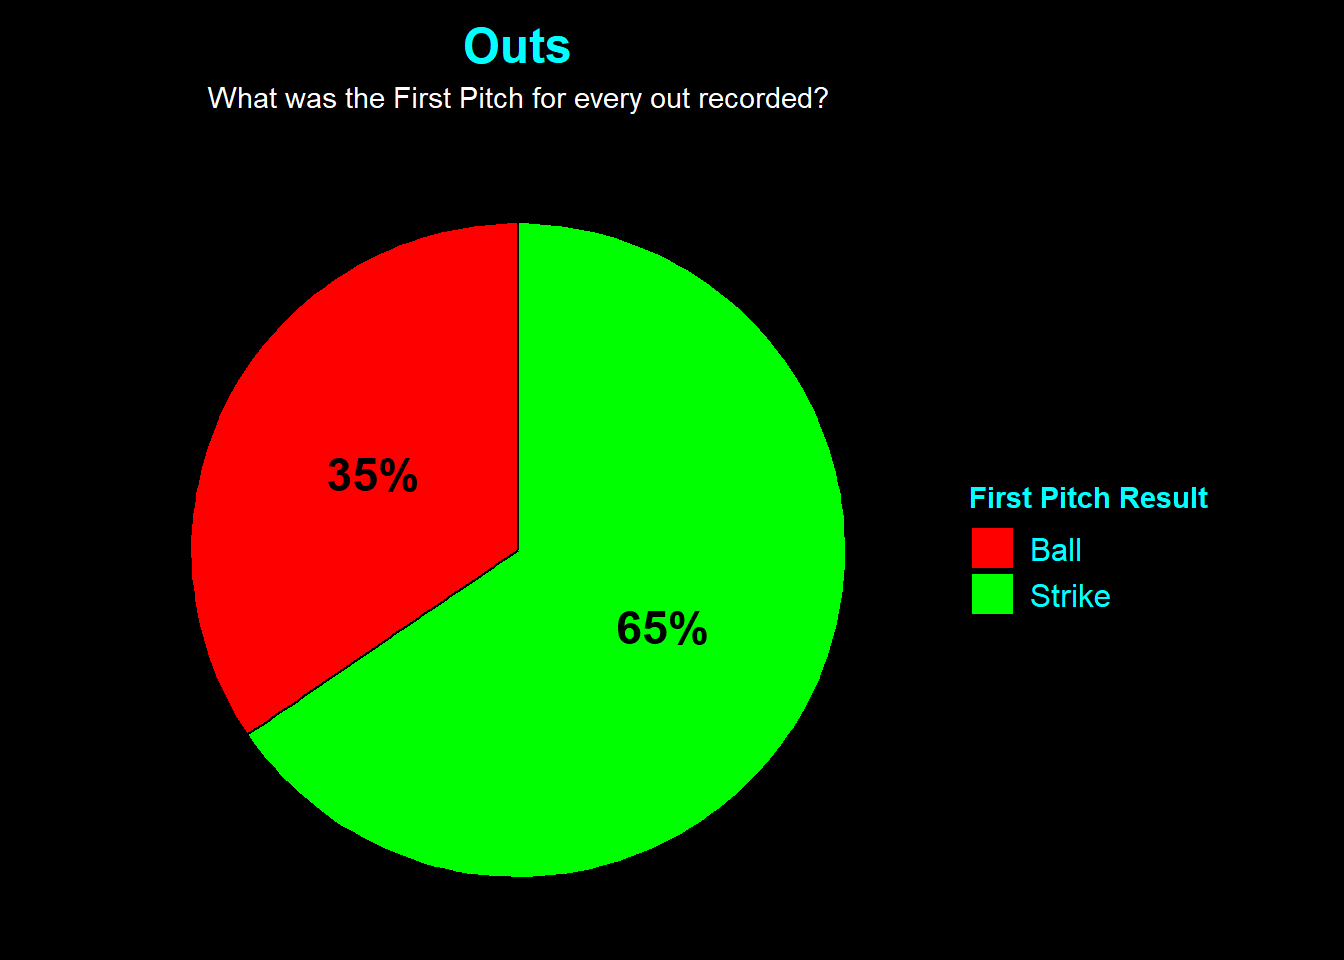
This chart aggregates every single out recorded (Strikeouts, Fly outs, Ground outs, etc.) and checks how the at-bat started.
Green Slice (Strike): The out occurred after the pitcher got ahead 0-1.
Red Slice (Ball): The out occurred after the pitcher fell behind 1-0.
Why is this important?
This is arguably the most telling chart of the three. You will likely see a massive Green slice here.
- Control Dictates Success: While Hits and Home Runs can sometimes happen on 0-1 counts (as seen in the previous charts),
Outs predominantly come from being ahead.
- The “Put-Away” Effect: When a pitcher is ahead 0-1, they can expand the zone. They don’t have to throw strikes. This leads to batters chasing bad pitches, resulting in weak contact or strikeouts.
⚠️ Why this data can be misleading
- Self-Fulfilling Prophecy: A 0-1 count forces the batter to be defensive. A 1-0 count allows the batter to be patient. If a batter walks on a 1-0 count, it doesn’t show up here (because it’s not an out). Therefore, the “Ball” slice might look smaller simply because many 1-0 counts turn into Walks, not Outs.